It’s important to take a step back and realize that this isn’t the first instance of a crypto crash, nor will it be the last. Crypto markets are inherently subject to highs and lows; such is their natural cycle. Notably, media outlets – both television and online – typically capitalize on these occasions by creating narratives that promote fear and panic because ultimately, they prioritize clicks and subscribers above all else in their search for new revenue streams.
The latest crypto crash refers to a significant drop in the value of cryptocurrencies like Bitcoin and Ethereum. Cryptocurrency is notorious as a highly volatile market and price swings, both up and down, are nothing out of the ordinary. This could be troubling news to traders or investors who own as they may suffer losses when selling at a lower rate than they paid. Nevertheless, long-term investor’s view dips in value as an opportunity to purchase more at a discounted price with the thought that the market will eventually come back up.
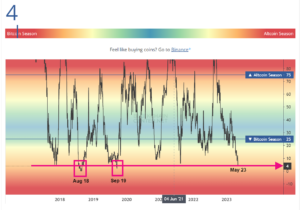
Bitcoin halving. The crypto crash has happened before.
Bitcoin’s halving cycle refers to a pre-programmed event that occurs every four years, in which the reward for mining new Bitcoin blocks is cut in half. This reduces the rate at which new Bitcoins are created and helps control inflation.
The halving event creates a supply shock, as there are fewer new Bitcoins available to be mined. This has historically led to significant increases in the price of Bitcoin as demand for the scarce asset increases.
We’ve seen this happen before in 2017 and in 2013, when the previous halving events occurred. In both instances, the price of Bitcoin surged in the months following the halving as demand for the scarce asset outstripped supply. When considering investing in Bitcoin, one must be aware that the value of the currency is not stable. Many different influences could cause it to fluctuate. Despite these potential differences, there are certain factors that regularly have an effect on its worth. However, the halving cycle is an important event in the Bitcoin ecosystem, and many investors and traders pay close attention to it when making investment decisions.
Price swings
The stock exchange and crypto market have different levels of volatility, with the crypto market generally being more volatile. Despite being a recent development in the financial industry, cryptocurrencies have been hindered in their growth by several elements. The crypto market is notably more petite than traditional stock markets, and with regulations still lacking it is easy to see why many are hesitant to invest. Additionally, due to its youth as an asset class it has yet to be thoroughly examined and tested.
For example, in recent years, the daily price swings of Bitcoin have been much larger than those of major stock market indices like the S&P 500. In April 2020, for instance, the price of Bitcoin dropped by over 40% in a single day, while the S&P 500 saw a daily decline of around 12% in March 2020 during the onset of the COVID-19 pandemic.
A stark contrast of performance occurred in May 2021, when the S&P 500 decreased a mere 2.1% daily as Bitcoin endured a drastic decline of over 30% within just one week.
These price swings can be even more extreme for other cryptocurrencies, with some experiencing daily price movements of 10% or more on a regular basis. By comparison, daily price swings for most stocks are typically less than 1%.
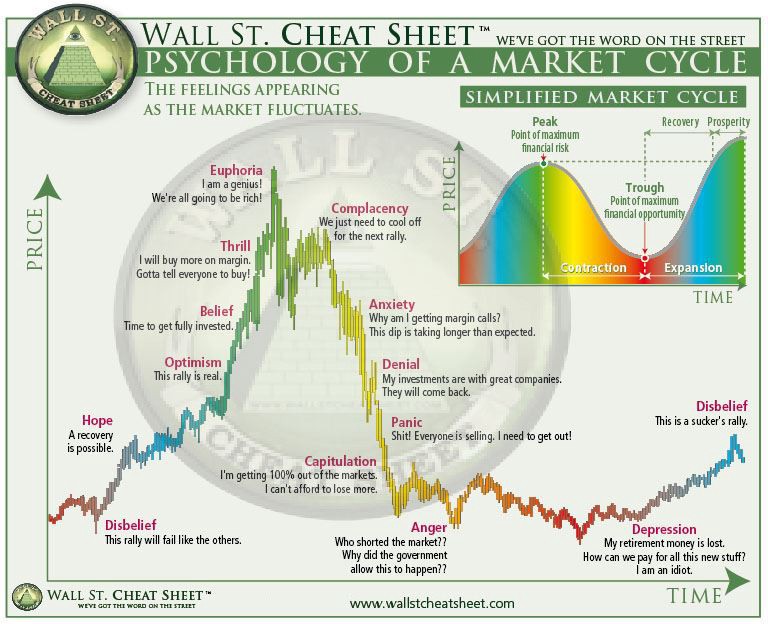
Market Psychology – Market Cycle
Market psychology and market cycles are two important concepts that are closely related. A market cycle chart is a graphical representation of the different stages of a market cycle and how market psychology affects those stages.
Market psychology refers to the emotions, beliefs, and attitudes of investors that drive their decision-making process. These emotions can range from fear and greed to optimism and pessimism. Market cycles refer to the repetitive patterns that financial markets tend to follow, consisting of four stages: accumulation, markup, distribution, and markdown.
The market cycle chart typically shows these four stages along with the corresponding emotions that investors experience during each stage. For example, during the accumulation stage, investors may feel pessimistic and fearful as they try to identify potential opportunities in the market. During the markup stage, investors may become increasingly optimistic and excited as prices rise, leading to a bubble. During the distribution stage, investors may become more cautious and skeptical as prices begin to plateau, leading to a market correction. And during the markdown stage, investors may feel fearful and panicked as prices plummet, leading to a crash.
Market psychology plays a critical role in each of these stages. For example, during the accumulation stage, contrarian investors may take advantage of the market pessimism and begin buying up assets, hoping to profit when the market eventually turns around. During the markup stage, many investors may become caught up in the excitement and euphoria, leading to irrational exuberance and overvaluation of assets. During the distribution stage, investors may begin to realize that the market is overpriced and start selling off their assets, leading to a market correction. And during the markdown stage, investors may become gripped by panic and sell off their assets at any price, leading to a market crash.
Overall, understanding the relationship between market psychology and market cycles can be useful in predicting market trends and making investment decisions. However, it’s important to keep in mind that market cycles are not always predictable, and unexpected events can disrupt the patterns of market behavior.