Trading view backtest of simple strategy using RSI that made 1% profit per day
I have been playing with a very simple but effective strategy on trading view pretty much exclusively based on the RSI (Relative Strength Index).
In this experiment, I used the 1-hour chart and randomly selected ALGO/USDT as my pair. I am using a custom RSI indicator in the video but essentially what I have changed in the settings compared to a regular RSI indicator is the period. For this example, I am using 33.
I did not select any specific dates and the entire purpose of this experiment was to go in blind practically unprepared and just do an eye-ball check to identify trend reversal with the RSI.
What is RSI?
RSI stands for Relative Strength Index, which is a technical indicator used in financial markets to measure the strength of a security’s price action. The RSI is typically calculated over a 14-day period and ranges from 0 to 100, with readings above 70 indicating an overbought condition and readings below 30 indicating an oversold condition. The RSI can be used to identify potential trend reversals or confirm existing trends, and it is widely used by traders and investors in their analysis of stocks, bonds, and other financial instruments.
Note: As I mentioned above I am using a longer time frame to calculate the RSI value. This means that the RSI will be less responsive to short-term price fluctuations and may provide a more stable and accurate view of the security’s price trend over a longer period of time. This makes it easier to identify solid peaks that result to more reliable trend lines. The signals are fewer but more accurate.
I don’t recommend using this strategy solely on one indicator and this is not financial advice. It is just a simple strategy back test.
The trading view backtest results were pretty remarkable. As you will see on the video I was just eyeballing lines and marking where the buy signal would have been. If I had taken more time I would most likely make more precise signals and found even more.
The strategy as I said is simple. Instead o fusing trendlines on the price candles. I am using trendlines on the RSI and looking for a reversal. I do not even look at the price and what it’s doing. I am just identifying two (or more) peaks on the RSI then drawing the trendline and when the RSI crosses above that line that is my buy signal. Pretty simple.
Once I marked all the signals I went back to the price to see where I would have placed my orders. The key to this strategy is using a 1.3 ratio. This is up to you and some people like a 1.5 or 2 to 1 ratio yes as you will see in the video some of those trades could have had a way higher profit, but I find that a faster in and out keeps the profitability percentage higher. You can always take enough profit at 1.3 to at the very least break even and let the rest run.
The stop loss is placed 1 ATR below the previous swing low in most cases but that as well is objective and up to your tolerance.
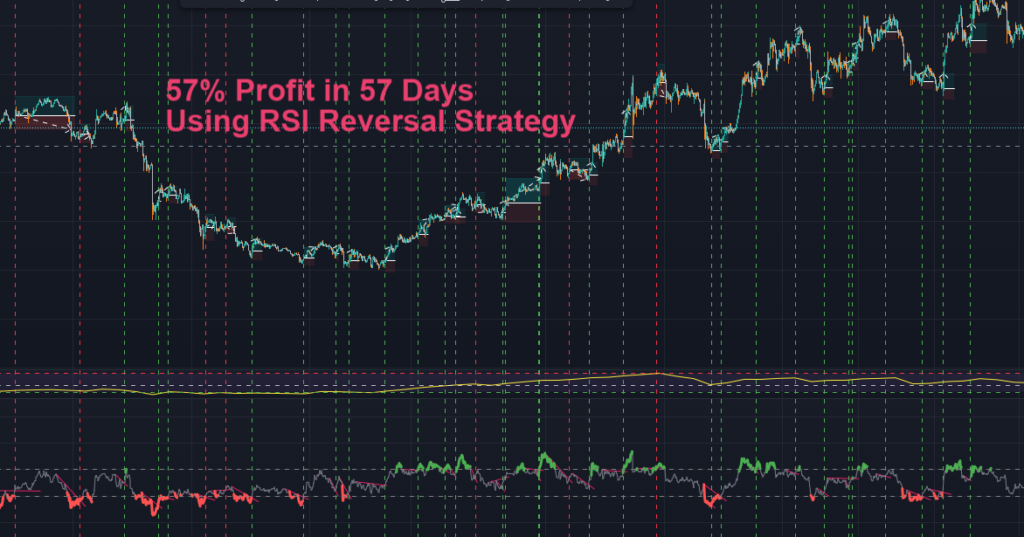
RSI Reversal Strategy Results
The trading view backtest ended up being a period of 57 days. In that period I was able to come up with 35 signals 28 were winners and had 7 losers. That’s an really good 80% success rate for this strategy
Using that 1.3 Ratio the final profit was 57% giving us that 1% per day average in 57 days.
If I was to just buy and hold for the same time period I would had ended up with 17.5% profit and would have to withstand a painful -27% drawdown.
What’s the catch? It can’t be that easy right?
Well that is correct. Back testing is good and always recommended before implementing a strategy with real money but it has its flaws too. When you are trading live the rsi changes from up to down and down to up each with each candle. It is a lot easier to go back in time when it has already printed and determine where the reversals happened but as you try to detect them in real time as it is happening that is when it becomes difficult and could fake you out as well. When it seems like it’s going up it will suddenly turn and break back down. Although this strategy has potential I will have to update the progress of it as i test it more in real time and see how the rsi is really responding and what i can do to correct false signals.